Every material has a skeleton. Not the kind you can see. Not the kind SEM shows you the surface, the texture, the shape of grains and particles. A deeper skeleton. The way atoms are arranged inside. Their positions. Their spacing. Their pattern. That internal architecture, the crystal structure, is what determines whether a material is strong or brittle, whether it conducts electricity or blocks it, whether a drug dissolves in your bloodstream in twenty minutes or sits in your stomach doing nothing for three hours.
X Ray Diffraction is the technique that reads that skeleton.
Where SEM shows what a material looks like on the outside, XRD tells you how the atoms inside are arranged, their crystal structure, phase composition, crystallite size, lattice strain, and degree of crystallinity. Change the arrangement and you change the material. Same atoms, different structure, completely different behaviour. Diamond and graphite are both pure carbon. One cuts glass. The other smears on paper. The difference Atomic arrangement. Crystal structure. The thing XRD measures.
Why X rays specifically Because their wavelength approximately 0.1 nanometres happens to be comparable to the spacing between atomic planes in crystalline materials. That’s not a coincidence anyone engineered. It’s a lucky match between the physics of X-ray production and the physics of crystal geometry.
When an X ray beam strikes a crystalline material, it interacts with the repeating atomic planes and produces a characteristic diffraction pattern. That pattern is as unique to a material as a thumbprint is to a person. Match the pattern, identify the material.
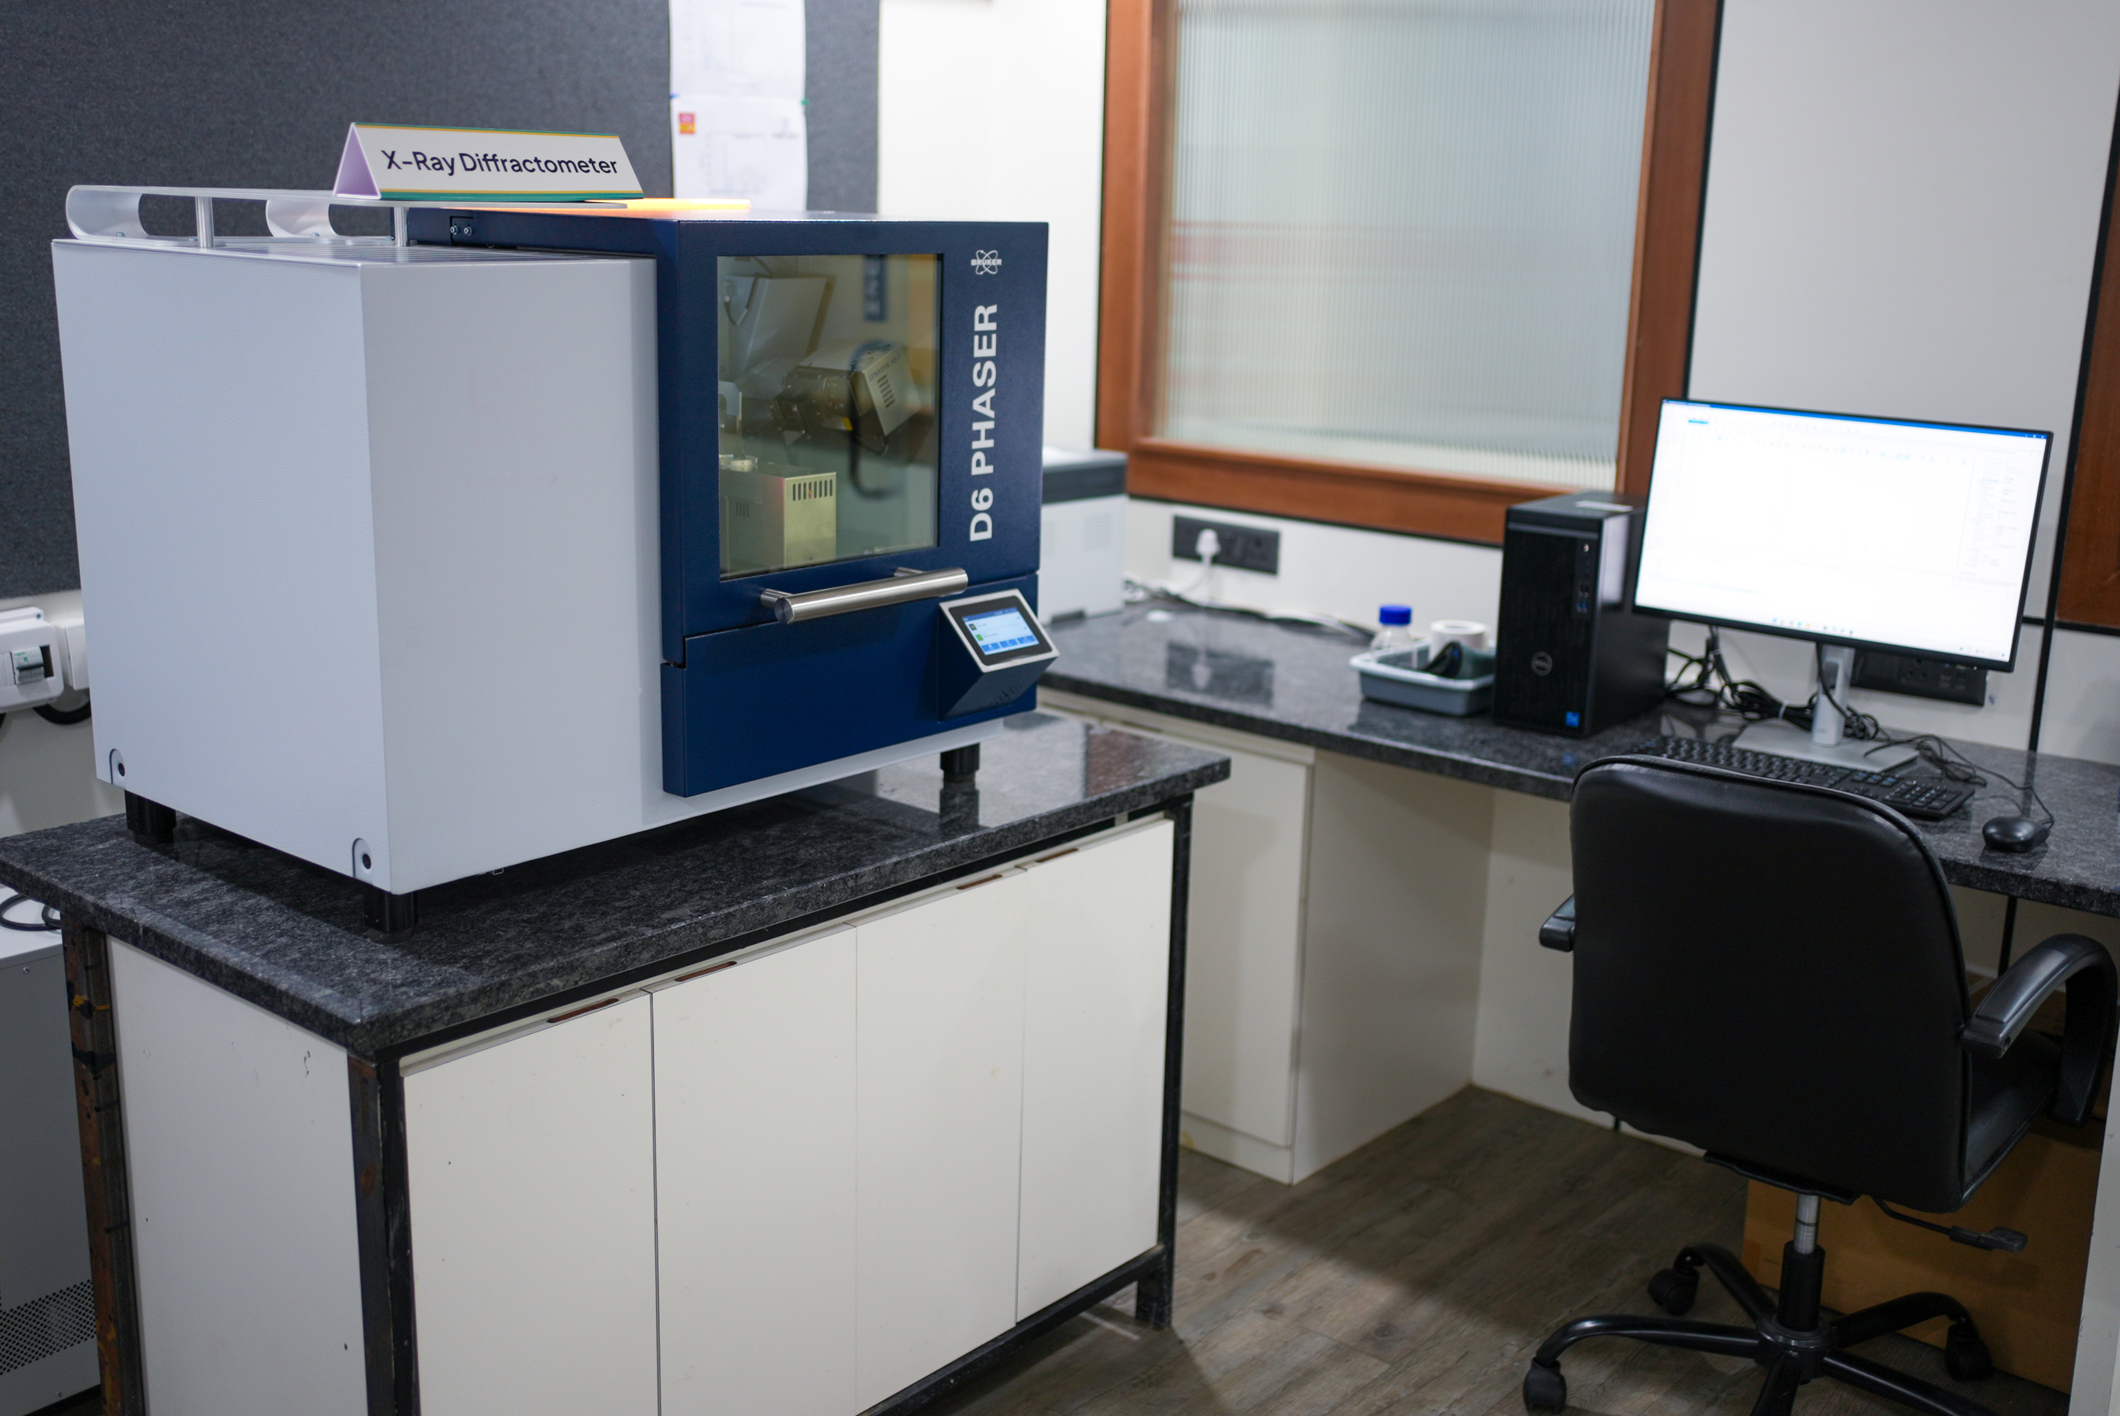
The Bruker D6 PHASER Technical Overview
The instrument sitting in the MNRDC’s lab is a Bruker D6 PHASER. Compact. Benchtop. Manufactured by Bruker India Scientific Pvt. Ltd., Germany. Installed in 2024. Cost ₹1.06 crore. And since it arrived, over 600 samples have been run through it. Six hundred. From pharmacy labs, materials science groups, battery researchers, construction materials teams, nano research projects all feeding samples into one instrument and getting answers back that no other technique at the MNRDC can provide.
How does it generate X rays? Electrons get accelerated into a copper target. When they slam into the copper atoms, X rays are produced specifically CuKα radiation, which is the standard X ray wavelength for the vast majority of crystallographic work worldwide. The instrument runs at two power modes 600W for standard analysis perfectly adequate for most samples and 1,200W high power mode, which doubles scan speed and boosts detection of trace phases. That second mode matters when you’re hunting for a minor phase hiding in a dominant matrix. Sometimes the thing you most need to find is the thing present at 2 or 3 percent. High power mode helps pull it out of the noise.
The detector is a LYNXEYE XE T a Position Sensitive Detector, PSD. And here’s why that matters practically. An old style detector captures one angle at a time. The beam scans through each angle sequentially. Slow. Tedious.
A PSD functions more like a wide angle camera capturing multiple diffraction angles simultaneously. Which means the D6 PHASER’s Continuous PSD fast mode produces clean, high quality diffraction patterns in minutes. Not hours. Minutes. For a research center handling 600 plus samples, that throughput isn’t a luxury. It’s a survival mechanism.
Other components worth knowing about. The MASS Motorised Air Scatter Screen sits between the sample and detector and cuts down background noise. Background noise in XRD is the equivalent of static on a radio; it obscures the peaks you’re trying to hear. MASS turns the static down.
A motorised goniometer arm handles precise angular scanning; the geometry of XRD demands angular precision measured in hundredths of a degree. And an internal liquid cooling loop manages a problem that most people don’t think about until someone explains it 99 percent of the input energy that hits the copper target converts to heat. Ninety nine percent. Only 1 percent becomes X rays. Without active cooling, the target would melt. Literally melt. The cooling system isn’t optional. It’s keeping the instrument alive.
Bragg’s Law The Mathematics of Crystal Analysis
One equation. The entire field of X-ray crystallography rests on it. Every XRD measurement, every phase identification, every lattice parameter calculation all traces back to this single line of mathematics.
nλ = 2d sinθ
Four variables. λ is the X ray wavelength known, because we chose the copper target. θ is the angle at which the X ray strikes the sample measured by the goniometer. d is the distance between atomic planes the thing we want to find out. And n is an integer representing the order of diffraction.
Here’s what happens physically. An X ray beam hits atomic planes inside the crystal. At most angles, the scattered rays interfere destructively; they cancel each other out. Silence. Nothing detected. But at the specific angle θ where Bragg’s Law is satisfied for a particular plane spacing d, something different happens. The scattered rays interfere constructively.
Every crystalline material has a unique set of atomic plane spacings. Different d values in different directions. Which means every crystalline material produces its own unique collection of peaks at specific 2θ angles. A fingerprint. Unique. Unmistakable. Show a crystallographer the peak positions and they’ll tell you what the material is the same way a forensic expert matches a thumbprint to a person.
Bragg’s Law is the translator. It converts a measured diffraction angle into an interplanar spacing. A collection of spacings into a crystal structure. A crystal structure into a material identity. One equation. The whole chain hangs on it. William Lawrence Bragg was 25 years old when he derived it, making him the youngest Nobel laureate in physics. Sometimes the most powerful tools in science are the simplest ones.
Reading the XRD Output The Intensity vs 2θ Graph
What comes out of the instrument the thing that ends up on screen, gets exported as a file, gets plotted for a thesis or a paper is an intensity versus 2θ graph. X axis the diffraction angle 2θ. Y axis the intensity of diffracted X rays at each angle. Simple axes. Dense information.
- Sharp peaks. Tall, narrow, well defined peaks mean a highly crystalline material. The atoms are arranged in an organised, repeating lattice. Everything’s in order. The crystal is doing what crystals do being periodic, being predictable, scattering X rays at precise angles.
- Broad humps. Diffuse, rounded bumps instead of sharp peaks. That’s an amorphous material. Atoms arranged randomly. No repeating pattern. Glass looks like this. So do some polymers. So do some pharmaceutical formulations where the drug has lost its crystalline form. The absence of sharp peaks isn’t a failed scan. It’s information. It’s the instrument telling you that the material has no long range atomic order. Now within those peaks, three things carry specific meaning.
- Peak position the 2θ value where the peak sits. This identifies the material. Match the positions against a reference database and you know what you’re looking at.
- Peak width. Broader peaks mean smaller crystallites. Narrow peaks mean larger crystallites. The relationship is quantified by the Scherrer equation, but the visual intuition is straightforward: a 5 nanometre crystal produces a broader peak than a 50 nanometre crystal of the same material. If peaks are broader than expected, the crystallites are small. Or there’s microstrain. Or both.
- Peak shift. The peak sits slightly left or right of where the reference says it should be. That’s a lattice strain. The atomic planes are being compressed or stretched by internal stresses. Shift to higher 2θ Compression planes squeezed closer together. Shift to lower 2θ Tension planes pulled apart. A shifted peak is the crystal telling you it’s under stress.
- At the MNRDC, scans typically cover the 10° to 80° 2θ range which captures the most diagnostically significant peaks for the majority of engineering and research materials. Publication ready graphs from MNRDC data are produced using Origin software. If you’re driven by discovery and innovation in life sciences, explore the Bachelor of Science (B.Sc.) in Biotechnology at Parul University!
ICDD PDF 4 The Global Reference Database
So you’ve got a diffraction pattern. Peaks at specific angles. Beautiful graph. Now what How do you go from “peaks at 38.2°, 44.4°, and 64.6°” to “this is face centred cubic silver”
You need a reference library. A massive one. Because the number of known crystalline materials on Earth runs into the hundreds of thousands, and each one has its own unique set of peak positions. Matching by hand flipping through printed cards, comparing angles one by one is how this used to work. Decades ago. Before databases went digital.
The MNRDC uses the ICDD PDF 4 database. ICDD stands for the International Centre for Diffraction Data. PDF stands for Powder Diffraction File not the document format, the crystallographic reference standard. PDF 4 is the state of the art paid tier of the ICDD system. Over one million reference patterns. One million. Every well characterised crystalline material that’s been measured and catalogued worldwide sits in that database.
Here’s how it works in practice. The software takes the experimental diffraction pattern of the peaks from the D6 PHASER and searches PDF 4 for matching entries. Each material in the database has a unique PDF card showing where its peaks should appear, how intense they should be, what crystal system it belongs to.
A match between the experimental pattern and a PDF entry confirms the identity. Not suggested. Confirms. With a database this comprehensive, the probability of a false match is vanishingly small.
PDF 4 also enables quantitative phase analysis. Not just “this sample contains Phase A and Phase B” but “this sample is 73 percent Phase A and 27 percent Phase B.” For researchers working with multi phase materials which, in the real world, is most researchers that quantitative capability matters enormously. A cement sample isn’t one phase. A battery electrode isn’t one phase. A pharmaceutical tablet isn’t one phase. Knowing the proportions changes everything.
TOPAS Software Rietveld Refinement for Quantitative Analysis
- Peak matching against a database tells you what’s in the sample. But what if you need more? What if you need precise lattice constants Exact phase proportions Crystallite size with statistical uncertainty Microstrain values that you can publish with confidence. That’s where TOPAS enters. Total Pattern Analysis Solutions. The MNRDC runs it alongside PDF 4 for advanced quantitative work.
- TOPAS implements the Rietveld refinement method and for anyone who hasn’t encountered Rietveld before, here’s what it does in plain terms. Rather than just looking at peak positions and comparing them to a database, Rietveld takes a different approach entirely. It starts with a hypothesised crystal structure.
- Then it calculates from first principles of X-ray scattering physics what the complete diffraction pattern should look like for that structure. Every peak. Every intensity. Every width. The whole pattern, mathematically simulated. And if you too are passionate about maths, explore Bachelor of Science(B.Sc.) in Mathematics at Parul University!
- Then it compares the calculated pattern to the measured pattern. They won’t match perfectly at first. So the software starts adjusting. Atom positions. Thermal parameters. Lattice constants. Crystallite size. Phase fractions. It tweaks each parameter iteratively, recalculates the pattern each time, compares again, tweaks again until the calculated pattern and the measured pattern converge as closely as possible.
- The output A set of quantitative crystallographic parameters. Precise lattice constants not approximate, precise. Phase proportions with percentages and error bars. Crystallite size in nanometres, with statistical uncertainty. Microstrain quantified, not guessed. These aren’t qualitative descriptions dressed up in numbers.
- They’re genuinely quantitative measurements derived from fitting the entire diffraction pattern simultaneously. That’s the power of Rietveld. And TOPAS is one of the most respected software implementations of it worldwide.
XRR Thin Film Thickness, Roughness, and Density
X Ray Reflectivity. XRR. Available as an add-on at the MNRDC, and it fills a gap that neither XRD nor GIXRD can cover.
XRD tells you crystal structure. GIXRD tells you the crystal structure of a thin film specifically. But what about the physical characteristics of that film How thick is it exactly How rough is the surface How rough is the interface between the film and the substrate underneath What’s the film’s density
XRR answers all four. Film thickness from 1 to approximately 500 nanometres. Surface roughness. Interface roughness. Material density. Four measurements from one technique.
The output looks different from XRD. Instead of sharp diffraction peaks, XRR produces a series of intensity oscillations and interference fringes as a function of angle. And reading those fringes is beautifully intuitive once someone explains the code.
- Wide oscillations the spacing between fringes is large. That means a thin film. Narrow, closely spaced oscillations thick film. The thicker the film, the faster the fringes oscillate.
- Rapidly decaying oscillations the intensity drops off quickly with angle. That means a rough surface. The roughness scatters X rays in random directions, killing the reflected intensity. Slowly decaying oscillations mirror smooth surfaces. The smoother the surface, the longer the oscillations persist.
Elegant. The physics encodes the film’s physical properties directly into the shape of the curve. No complex interpretation needed once you know what wide versus narrow and fast decay versus slow decay mean, you can glance at an XRR curve and immediately estimate film thickness and surface quality before the software even finishes fitting.
XRR is requested separately at the MNRDC and is available for samples requiring thin film characterisation beyond crystal structure.
Applications Across Research and Industry
Where does all of this matter? Everywhere that materials matter. Which is everywhere.
- Pharmaceuticals and drug formulation – This application alone justifies the ₹1.06 crore investment for any institution doing pharmacy research. Different polymorphs of the same drug, same molecule, different crystal packing can have dramatically different dissolution rates and bioavailability. Paracetamol has multiple polymorphs. So does ritonavir. So does carbamazepine. A drug company that ships the wrong polymorph doesn’t just have a quality problem. It has a patient safety problem. XRD confirms the active pharmaceutical ingredient is in the correct crystalline form. Catches unwanted phase transitions during processing. Monitors crystallinity changes during formulation development. When the FDA or CDSCO asks “prove it’s the right polymorph” XRD is the answer.
- Battery research – Lithium ion, sodium ion, solid state every battery technology depends on electrode materials that undergo structural changes during charge discharge cycles. Lithium ions intercalate into and de intercalate from crystal lattices. That process changes the lattice parameters. XRD tracks those changes enabling real time optimisation of energy storage performance. If the crystal structure degrades after 500 charge cycles, XRD shows exactly how and where. Apply now for 2026 admissions at Parul University and take the first step toward your future in science, technology, and innovation!
- Semiconductor manufacturing – Every chip begins as a crystalline substrate. Thin film layers deposited on top must have specific crystal orientations and quality. XRD and GIXRD for the thin films specifically verifies that quality at every step.
- Geology and archaeology – Mineral identification in rock samples. Clay mineral analysis in soil. Historical manufacturing techniques revealed through the crystal phases present in ancient ceramics, pigments, and metals. The past leaves its fingerprints in crystal structure, and XRD reads them.
FAQs
What is XRD analysis used for in pharmaceutical research Polymorphs.
Different polymorphs of the same drug identical molecule, different crystal packing can behave completely differently in the body. Different dissolution rates. Different bioavailability. Sometimes different stability. XRD confirms the active pharmaceutical ingredient is in the correct crystalline polymorph. It catches unwanted phase transitions that might occur during processing, grinding, compressing, heating. And it monitors crystallinity changes during formulation development. The ICDD PDF 4 database at the MNRDC enables unambiguous phase identification and quantitative phase proportions so not just “which polymorph” but “how much of which polymorph
What is the difference between XRD and SEM
They answer different questions about the same material. SEM uses an electron beam to image the surface morphology, texture, grain structure, particle shapes. What the material looks like. XRD uses X rays to probe the internal crystal structure, atomic arrangement, phase composition, crystallite size, lattice strain. What the material is and how its atoms are organised. SEM is surface vision. XRD is structural X-ray vision. They’re complementary knowing surface morphology without knowing crystal structure is half the picture, and vice versa. Both are available at the MNRDC, and many research projects use both on the same samples.
What is GIXRD and when is it needed instead of standard XRD
When the sample is a thin film on a thick substrate. Standard XRD can’t help because the X rays punch through the film and diffract mostly from the substrate, drowning out the signal from the coating you actually want to study. GIXRD tilts the X ray beam to graze the surface at less than 1 degree angle. At that shallow approach, the beam stays within the thin film instead of penetrating through it. The film’s crystal structure becomes visible. Essential for anti reflective coatings, semiconductor thin film layers, surface treated metals, protective coatings on implants any situation where a thin layer’s crystal structure needs characterising independently from whatever it’s sitting on.