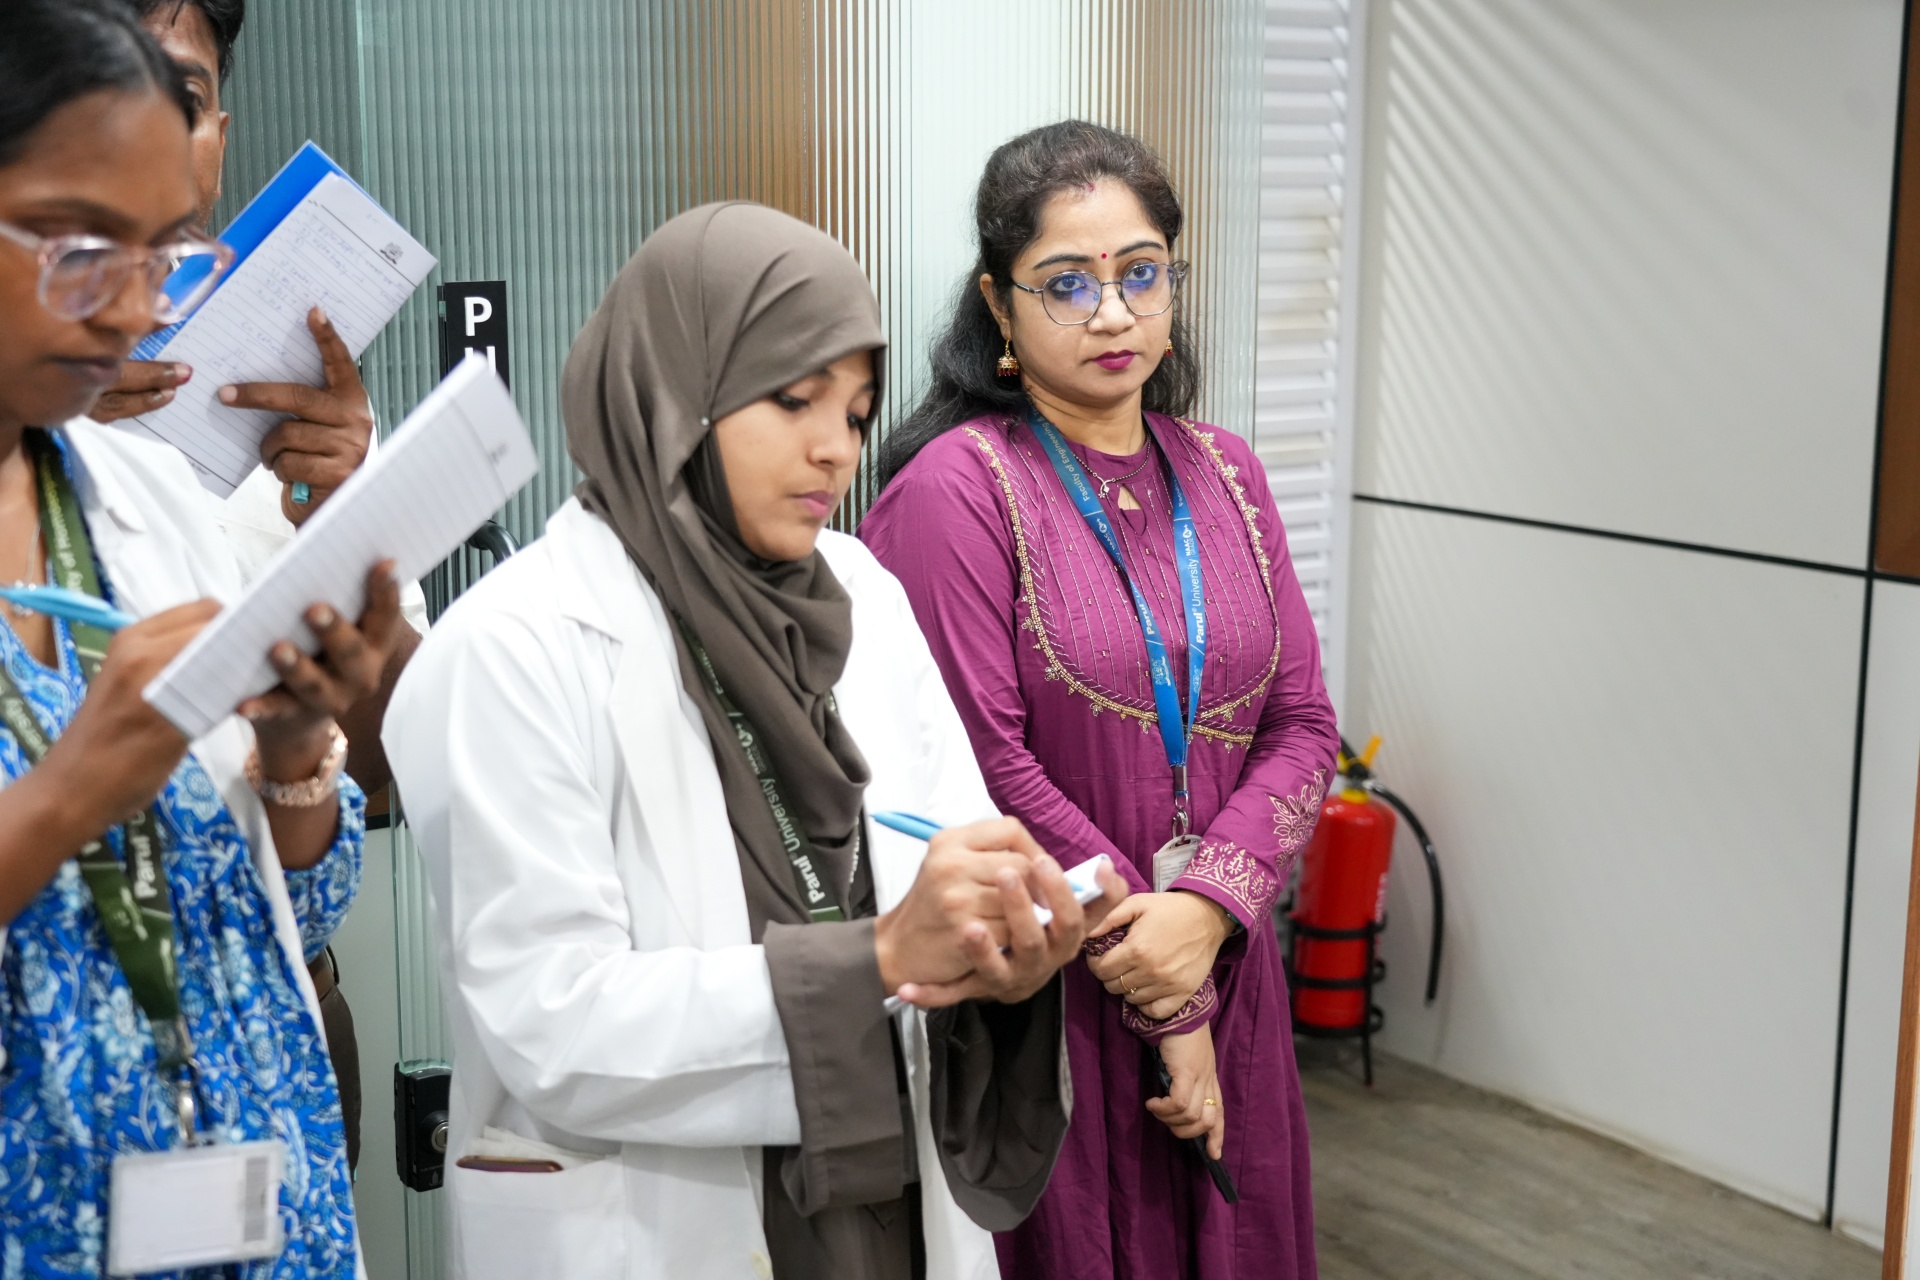
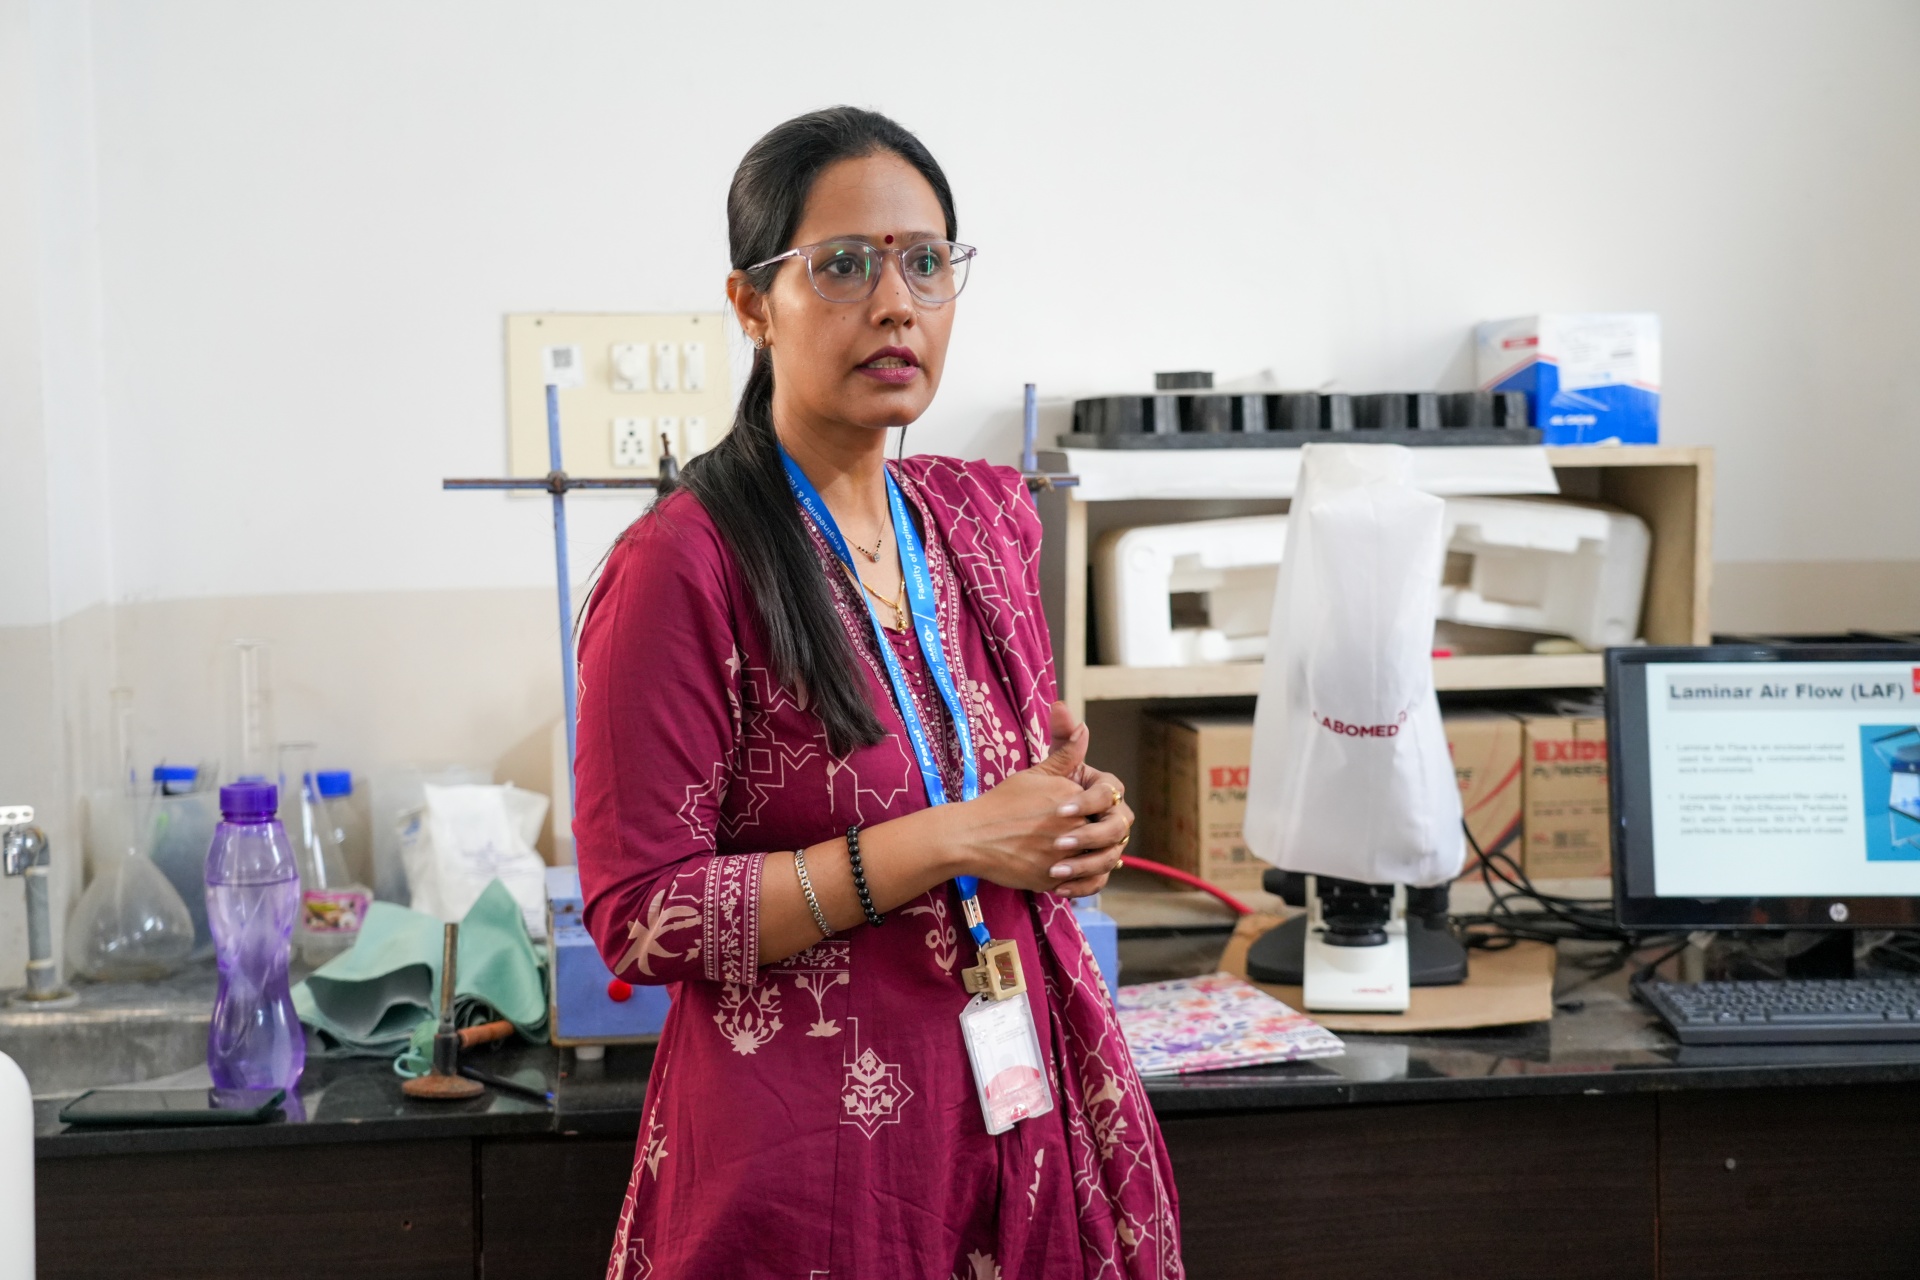
The MIC Antimicrobial Assay track at the MNRDC, Three-Day Hands-On Workshop on Microbial Cell Factories, ran across 11, 12, and 13 June 2026 at the PIAS Third Floor Forensic Chemistry Laboratory at Parul University.
Dr Juhi Saxena is an Associate Professor in the Department of Biotechnology, Faculty of Engineering & Technology at Parul University. She started this exclusive workshop with an MIC – Minimum Inhibitory Concentration of an agent, as it has the lowest concentration, as expressed in micrograms per millilitre or milligrams P.L., it even completely prevents the growth of a microorganism under the holistic control in vitro based conditions after the overnight incubation. The most impactful factor was that students from different disciplines got to execute the entire MIC framework from medium preparation to serial dilution via bacterial inoculation to optical density measurement via quantitative analysis as well!
The workshop hub coverage spanning both technical tracks and the two expert sessions is documented at the workshop master hub. The parallel microalgae cultivation track is documented at the microalgae workshop article, and Dr Puja Sandhbor’s nanomedicine expert session at the Tata Memorial ACTREC session coverage. Dr Juhi Saxena’s broader research record, h-index, and Stanford-Elsevier global top 2 percent ranking are documented at the faculty currently serving record, with the institutional research infrastructure at the accreditation record.
Why MIC Matters - Foundational testing of antimicrobial methodology
The MIC assay workshop even focused on how it produces the quantitative measurement across antimicrobial development, clinical pharmacology, and daily evaluation of antibiotics. It answered a very core question – what is the lowest concentration of an agent that prevents growth of a specific microorganism strain. It answered how it enables comparison between candidate and existing market options, identifying patterns in bacterial strains, dose calculation, and a holistic infrastructure for updating the public health system that is required.
Beyond the clinical and regulatory applications, MIC testing serves as the primary methodology for evaluating newly developed antibiotics against existing alternatives. If a research team has developed a candidate antibiotic compound, the MIC assay produces the comparative effectiveness data that determine whether the new compound has a competitive advantage over existing market products. The example commonly used in teaching contexts illustrates this directly: if a market antibiotic inhibits microbial growth at 2 percent concentration and a newly developed handmade antibiotic inhibits growth at 1 percent concentration, the newly developed compound is more effective per unit concentration and may justify continued development toward commercial scale-up.
Day 1: medium preparation, autoclave sterilisation, laminar airflow workflow, and bacterial inoculation
Day 1 of the MIC track covered the foundation infrastructure that determines whether the assay will produce reliable, reproducible results. Contamination from external microorganisms is the main challenge in MIC testing, with the sterile workflow being the primary control against contamination. The Day 1 protocol covered medium preparation, autoclave sterilisation, laminar airflow (LAF) cabinet operation, and the inoculation methodology that introduces test microorganisms into the prepared medium.
- Mueller Hinton (MH) broth medium preparation. Students calculated the salt quantity required for a 30 ml medium volume from the standard concentration of 21 grams per 1000 ml printed on the MH broth bottle. The calculation yielded 0.63 grams of MH broth for 30 ml of distilled water. The mixture was prepared in a flask, shaken with proper grip stabilisation, sealed with a cotton plug, covered with silver foil to prevent moisture ingress, and kept untouched for 24 hours before autoclave sterilization.
- Autoclave sterilisation methodology. The autoclave uses high-pressure saturated steam to sterilise laboratory equipment, materials, culture media, glassware, pipette tips, and other equipment by killing bacteria, viruses, fungi, and spores. Autoclave operation prevents contamination during MIC testing. and The autoclave also serves as the sterile disposal pathway for contaminated waste after experiment completion.
- Laminar Air Flow (LAF) cabinet operation. The LAF cabinet blows HEPA-filtered air in a uniform direction through the workspace, removing dust and microorganisms from the air during sterile execution. The cabinet was exposed to UV light before, which is used to prevent any microorganism growth within the cabinet environment. Students operated with the glass kept half-open and faces positioned in front of the glass slab for injury prevention from glass breakage, with both hands maintained inside the cabinet throughout the experiment to prevent contamination.
- Bacterial inoculation methodology. Inoculation introduces measured amounts of test bacteria into the sterile culture medium under aseptic conditions. The protocol included 5-step hand sanitisation, removal and heat sterilisation of the cotton plug and flask neck, micropipette delivery of 100 microlitres of E. coli bacteria, discarding of the contaminated micropipette tip into a sodium hypochlorite discard box, and resealing of the flask. The flask was then kept for 24 hours for bacterial growth in the nutrient medium.
Day 2: antibiotic serial dilution methodology and 96-well plate setup
Day 2 introduced the principal MIC methodology: antibiotic serial dilution in a 96-well plate. The serial dilution approach allows simultaneous testing of multiple antibiotic concentrations in parallel, reducing the medium and antibiotic volumes required while increasing the statistical robustness of the resulting MIC value through replicate testing.
- 96-well plate structure and labeling. The sterile 96-well plate provides a small reaction chamber in each well where the growth medium, antibiotic, and bacterial culture combine in fixed quantities. Each well contains a different antibiotic concentration, allowing identification of the concentration at which the microorganism stops growing. Wells require precise labeling to prevent confusion during observation. The 96-well plate format saves time, requires smaller medium and antibiotic quantities, and allows many samples to be tested together under controlled laboratory conditions.
- Two-fold serial dilution methodology. The peak antibiotic concentration was added in the first part, containing half the concentration of the previous one. This series for the workshop even ran from 32 micrograms per millilitre in well 1 via 16,8,4,2,1,0.5,0.25,0.125, and 0.0625 micrograms per millilitre via Wells 2, via 10. Interestingly, Well 11 served as the growth controller and Well 12 led it as the Sterility Control for assay validation!
- Initial stock concentration calculation. The stock concentration calculation used the standard dilution formula C1V1 = C2V2 where C1 is the stock concentration, V1 is the stock solution volume, C2 is the final concentration required, and V2 is the final volume. For a final concentration of 32 micrograms per ml in 200 microlitre final volume with 20 microlitre stock transfer, the stock concentration calculation yielded 320 micrograms per ml. The formula application supports flexible stock preparation across different antibiotic compounds and final concentration requirements.
- Antibiotic compounds tested. Cefixime and Azithromycin. Cefixime is a third-generation cephalosporin antibiotic effective against a range of gram-negative bacteria. Azithromycin is a macrolide antibiotic with broad-spectrum activity against gram-positive and atypical gram-negative bacteria. Both compounds are commonly used in clinical practice, making them appropriate reference compounds for student MIC training.
- Test microorganisms. coli (Escherichia coli) and S. aureus (Staphylococcus aureus). E. coli is the gram-negative reference organism used widely in antimicrobial testing, alongside its presence in human enteric microflora. S. aureus is the gram-positive reference organism used for testing against compounds with activity against skin and soft-tissue pathogens. Testing both organisms produces comparative effectiveness data across the gram-positive and gram-negative bacterial divisions.
Bacterial inoculation into the 96-well plate and incubation conditions
After serial dilution preparation, bacterial cultures of E. coli and S. aureus were added to each well using a micropipette under aseptic conditions. Equal volumes of bacterial suspension were maintained across wells to ensure that all antibiotic concentrations were tested under identical conditions. Maintaining consistent bacterial concentration per well is essential because variation in starting bacterial inoculum would confound the MIC determination by producing concentration-effect curves that reflect both the antibiotic effect and the inoculum size effect.
The 96-well plate was incubated at 37 degrees Celsius for 18 to 24 hours. The incubation temperature of 37 degrees Celsius corresponds to human body temperature, which is the standard culture temperature for human-pathogenic bacterial species. The incubation duration of 18 to 24 hours allows bacterial cultures sufficient time to reach detectable visible growth in wells where the antibiotic concentration was insufficient to inhibit growth. Proper incubation conditions across temperature, duration, and atmospheric composition are essential for reproducible MIC results.
Day 3: visual observation, spectrophotometric measurement, and percentage inhibition analysis
Day 3 covered the analytical phase of the MIC assay. Visual observation identified wells showing turbidity (cloudy appearance indicating bacterial growth) versus clear wells (no visible bacterial growth indicating effective antibiotic concentration). The first well showing no visible bacterial growth was identified as the candidate MIC value.
- Spectrophotometric optical density measurement. A UV-Vis spectrophotometer measured the amount of light absorbed by each well, providing the Optical Density (OD) value as quantitative output. Higher OD values indicate more bacterial growth and the corresponding reduced antibiotic effectiveness at that concentration. Lower OD values indicate reduced bacterial growth and the corresponding antibiotic effectiveness. The instrument operates on the Beer-Lambert’s law principle, providing more accurate and quantitative results than visual observation alone.
- UV-Vis spectrophotometer instrumentation. The instrument consists of a light source (commonly deuterium lamp for UV and tungsten lamp for visible spectrum), a monochromator (prism or diffraction grating) that selects a specific wavelength, a sample holder for the cuvette or 96-well plate, a detector (photodiode or photomultiplier tube) that converts the transmitted light signal into electrical signal, and a readout device (computer or digital screen) that displays the OD values.
- Percentage growth calculation. Percentage Growth = (OD of Sample / OD of Growth Control) x 100. For example, if the Growth Control OD is 0.7860 and a sample OD is 0.6149, the percentage growth is (0.6149 / 0.7860) x 100 = 78.23 per cent. The Growth Control represents 100 per cent bacterial growth (bacteria without antibiotic), while the Sterility Control represents zero bacterial growth (medium without bacteria or antibiotic).
- Percentage inhibition calculation. Percentage Inhibition = 100 – Percentage Growth. Continuing the example: 100 – 78.23 = 21.77 percent inhibition. Higher percentage inhibition values indicate better antimicrobial activity of the test antibiotic at that concentration. Increasing antibiotic concentration generally produces increasing percentage inhibition values across the dilution series.
- Graph plotting and data interpretation. Percentage growth and percentage inhibition values were plotted against antibiotic concentration on the X-axis. The graphical representation supports visual comparison across antibiotic concentrations, identification of the inflection point where inhibition becomes substantive, and the concentration showing maximum inhibition. The MIC value corresponds to the first well showing no visible growth in the dilution series.
MIC results and antimicrobial activity comparison
The MIC assay successfully evaluated Cefixime and Azithromycin against E. coli and S. aureus across the 32 to 0.0625 microgram per millilitre serial dilution range. Visual observation alongside spectrophotometric OD measurement produced the complete dataset for percentage growth and percentage inhibition calculation. As expected, increasing antibiotic concentration produced decreasing bacterial growth and increasing percentage inhibition. The lowest concentration showing no visible bacterial growth in the dilution series was identified as the MIC value for each antibiotic-microorganism combination.
The comparative MIC values across Cefixime and Azithromycin against E. coli and S. aureus provide the foundation data for understanding the spectrum of activity that each antibiotic compound demonstrates. Lower MIC values indicate greater potency, with the comparative analysis supporting clinical and research decisions about which compound is preferred for specific microorganism profiles. The full dataset from the workshop is maintained in the MNRDC research records.
Dr Juhi Saxena and the Stanford-Elsevier global scientist context
Dr Juhi Saxena, Associate Professor in the Department of Biotechnology at the Faculty of Engineering and Technology, led the MIC track across the workshop. Dr Saxena is among the seven faculty members at Parul University listed in the Stanford-Elsevier global top 2 percent of scientists. Her h-index is 23 and i10-index is 35, with research focus across General Clinical Medicine and Biotechnology. The Stanford-Elsevier ranking is calculated by Elsevier using Scopus citation data and a methodology developed at Stanford University, evaluating approximately 8 million researchers globally and listing the top 2 per cent.
Dr Saxena’s research portfolio includes biopharmaceutical applications, microbial biotechnology, and clinical biotechnology, which directly connect to the antimicrobial development themes supported by the workshop’s MIC methodology. Beyond Dr Saxena, the Faculty of Pharmacy at Parul University includes additional Stanford-Elsevier ranked faculty whose research intersects with antimicrobial and pharmacological themes, including Dr Mange Ram Yadav (h-index 36, Medicinal and Biomolecular Chemistry), Dr Deep Pooja (h-index 37, Pharmacology and Pharmacy, polymers, drug delivery systems), and Dr Bhupendra Gopalbhai Prajapati (h-index 34, Pharmacology and Pharmacy, Oncology and Carcinogenesis).
FAQs
What is the Minimum Inhibitory Concentration (MIC) and how is it measured?
The Minimum Inhibitory Concentration (MIC) is the lowest concentration of an antibacterial agent, expressed in micrograms per millilitre or milligrams per litre, that completely prevents visible growth of a test microorganism strain under strictly controlled in vitro conditions after overnight incubation. The MIC is measured through a structured laboratory protocol involving medium preparation (Mueller Hinton broth is the standard), autoclave sterilisation of equipment and media, serial dilution of the test antibiotic across a concentration range (commonly two-fold dilution from a stock concentration), inoculation of each dilution with a measured volume of test bacterial culture, incubation at 37 degrees Celsius for 18 to 24 hours, and observation for visible bacterial growth in each well. The first well showing no visible bacterial growth in the dilution series is identified as the MIC value. Spectrophotometric optical density measurement using a UV-Vis spectrophotometer provides quantitative confirmation alongside visual observation, with percentage growth and percentage inhibition calculations supporting comparative analysis across antibiotic concentrations.
What was tested at the MNRDC Parul University MIC workshop?
The MIC Antimicrobial Assay track at the MNRDC Three-Day Hands-On Workshop on Microbial Cell Factories (11-13 June 2026) tested two antibiotics against two bacterial strains. The antibiotics were Cefixime (a third-generation cephalosporin antibiotic effective against a range of gram-negative bacteria) and Azithromycin (a macrolide antibiotic with broad-spectrum activity against gram-positive and atypical gram-negative bacteria). The test microorganisms were E. coli (Escherichia coli, the gram-negative reference organism for antimicrobial testing) and S. aureus (Staphylococcus aureus, the gram-positive reference organism for skin and soft-tissue pathogen testing). The two-fold serial dilution ran from 32 to 0.0625 micrograms per millilitre across Wells 1 through 10 with Growth Control (Well 11) and Sterility Control (Well 12). Students executed the complete methodology from Mueller Hinton broth preparation through autoclave sterilisation through laminar airflow inoculation through serial dilution through 18-24 hour incubation at 37 degrees Celsius through visual observation and spectrophotometric OD measurement. The track was led by Dr Juhi Saxena (Associate Professor, Department of Biotechnology, Faculty of Engineering and Technology, Parul University).
Who leads antimicrobial research at Parul University and what are the broader research themes?
Dr Juhi Saxena, Associate Professor in the Department of Biotechnology at the Faculty of Engineering and Technology, leads antimicrobial assay training including the MNRDC Microbial Cell Factories Workshop. Dr Saxena is among the seven faculty members at Parul University listed in the Stanford-Elsevier global top 2 percent of scientists, with h-index 18 and i10-index 29, research focus across General Clinical Medicine and Biotechnology. Adjacent antimicrobial and pharmacological research at Parul University includes Dr Mange Ram Yadav (Senior Professor Research, Faculty of Pharmacy, h-index 36, Medicinal and Biomolecular Chemistry), Dr Deep Pooja (Associate Professor, Faculty of Pharmacy, h-index 37, Pharmacology and Pharmacy with focus on polymers and drug delivery systems), and Dr Bhupendra Gopalbhai Prajapati (Professor Research Cadre, Faculty of Pharmacy, h-index 34, Pharmacology and Oncology). The broader research portfolio at Parul University includes Rs 58.31 crore in government-funded research projects across 315 funded projects, with the R&D Centre recognised by the Department of Scientific and Industrial Research (DSIR) under the Scientific and Industrial Research Organisation (SIRO) framework. The Times Higher Education Sustainability Impact Ratings 2026 places Parul University in the Top 10 in India for SDG 3 (Good Health and Well-Being).